
The more thoroughly you study your survey results, the more insights you will likely gain from them. As a result, the emphasis of this article is on an essential data analyzing tool- Cross Tabulation, also known as Cross Tabs, and how it affects your survey insights.
Without analysis, conducting surveys is only half the task. To be honest, there is no purpose in collecting data through surveys unless it is properly analyzed. However, using technologies like cross tabs, data are transformed into insights.
What are cross tabs?
“Cross tabulation”, according to humans of data, “is a method to quantitatively analyze the relationship between multiple variables”.
They are important tools for analyzing data in greater depth. Cross tabulations organize your data into a table that divides respondents according to common background information or survey replies, enabling you to compare the results of each group. This enables you to better comprehend each response group and determine how they differ from one another.
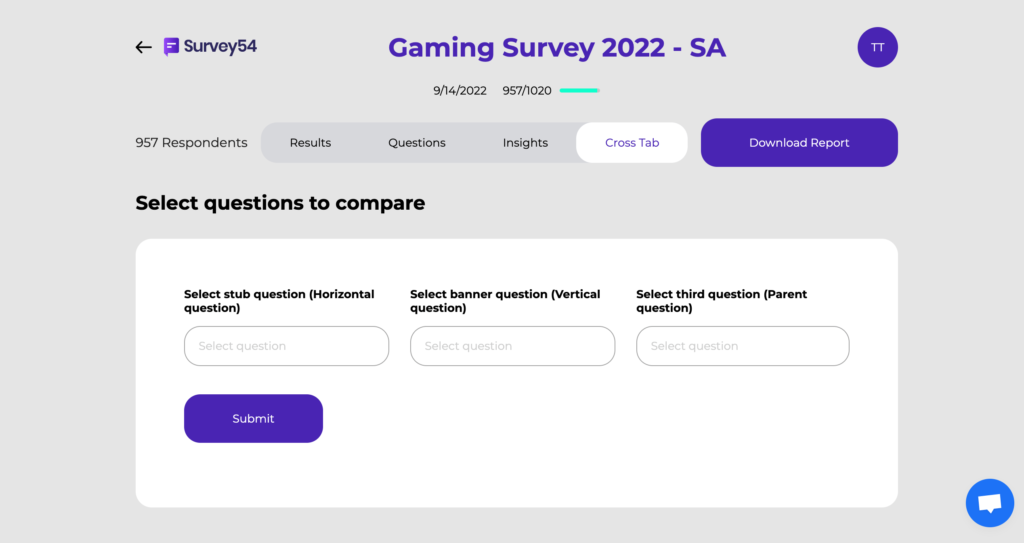
Cross tabs are advantageous, but it might be cumbersome to manually generate a table and load survey data into it before beginning analysis. Fortunately, you do not have to. The cross-tab reporting feature on our self-serve survey dashboard compares the responses of various groups of respondents automatically, allowing for easy comparison.
Cross tabs are distinguished from other survey analysis tools by their ability to compare findings across various dimensions. They enable you to make informed judgments based on unprocessed data by recognizing patterns, trends, and correlations between parameters.
What are insights?
Insights are data points that can be collected to aid in drawing conclusions and guiding future actions. They are the results of an analyzed data set. When conducting research and acquiring raw data, you are expected to examine the information for comprehension and draw appropriate conclusions. The conclusion you arrive at after examining the data with tools such as Cross tabs and identifying the exercise’s findings is your insight.
Some of the most essential information you can glean from market research, for instance, is why clients behave as they do. You can learn how they perceive a brand, which marketing messages resonate the most with them, and receive feedback on products or campaigns. These are insights!
How can Cross tabs contribute to the Data Analysis Process?
This is a legitimate concern. How can cross-tabulation facilitate the process of data analysis? Well, there are several possible beginning points. Some are:
More clarity
One of the worst aspects of raw data is that it can be extremely confusing. It simultaneously alludes to various patterns with little substance. With cross tabs, however, this information is separated into less complicated groups for straightforward readings. Cross-tabulation analysis simplifies and streamlines the data analysis procedure from the outset.
Easily reveals insights
Large data sets are daunting, which renders the entire analytical process overwhelming. Well, not if you utilize Cross tabs to divide the unprocessed data into manageable subsets. With cross tabs, researchers can more easily get insight into the correlations between categorical data. Without cross tabs, the same insights would have required a tremendous amount of manual labor.
Predicts the upcoming step
Cross tabs facilitate the interpretation of data and the prediction of future actions, which is advantageous for researchers with a limited understanding of statistical analysis. As with cross-tabulation, the correlation of categorical variables requires no knowledge of statistical programming. This information enables experts to evaluate existing and future initiatives and make accurate predictions.
Facilitates your decision
Cross-tabulation aids in the discovery of actionable insights that affect your objectives. With these insights, you can make business and brand-affecting decisions. The insights provided by cross-tabulation confirm your decisions, enabling you to conduct a more effective data analysis.
Delivers valuable information
In each case of cross-tabulation, the data you and your team ultimately obtain is the relevant data. Data that can be relied upon for action. And this is the entire purpose of data analysis: obtaining relevant information (data) to facilitate change.
Less probability of error
Analyzing huge data sets is difficult. Errors are inevitable regardless of the analysis method employed. However, cross-tabulation reduces the likelihood of inaccuracy by categorizing raw data into digestible groups. This is another reason why cross tabs make data processing so efficient overall.
Where do we use Cross-Tab Analysis for actionable insights?
The Cross tabs analysis is utilized in a variety of contexts, including gaining an in-depth understanding of employee survey data. However, we are about to discover other various applications of cross-tables;
Customer Conduct
Globally, businesses are continuously attempting to develop more efficient methods for retaining customers. Similar to hiring new staff, obtaining new clients requires significantly more effort and money than retaining existing ones. To accomplish this, though, you must monitor their conduct. Analyze similar patterns, determine when a particular habit begins, and determine how long it takes a client to modify a particular behavior.
The cross-table study is ideal for this purpose. Simply provide the consumer data, choose the factors to study, and utilize this research strategy. Certainly, you will not be dissatisfied.
Market Research Plus Much More!
In actuality, cross-tabulation is employed during product and campaign testing, design adjustments, and sales support.
The procedure is identical. Together with your team, you pick pertinent criteria, regions, and data for this analytical technique in order to discover insightful patterns. This pattern facilitates organizational transformations that ultimately contribute to sustained growth.
Extensive Research
Did you not see this coming? Well, if cross-tabulation can glean profound insights from the data of a single business, it will always perform similarly miraculous feats in large-scale private, public, and non-profit research projects. For this reason, it is one of the first quantitative analytic methods that researchers consider.
Proceed with It!
This entire article plainly points to one thing. What is it?
Cross-tabulation is one of the most effective methods for extracting valuable insights from noisy data. Survey dashboards equipped with Cross tabs, such as Survey54’s, are unquestionably the most effective analytic tools in Africa.
Our AI-enabled dashboard will assist you in conducting the most effective surveys, after which you can utilize its in-built cross-table analysis tool to discover everything pertinent to the expansion of your organization.
Not worth a second consideration. We want you and your business to prosper. So, communicate with us and proceed!